
Covered Call Performance Since Launch: 1,200+ Trades and What the Market Really Did
- Chuck Shmayel
- Mar 8
- 4 min read

Tracked 1,204 Covered Call Opportunities Since Jan 1 — Here’s What Actually Happened
Since January 1st I’ve been running a structured covered call analysis model that scans a large universe of stocks and identifies potential call-selling opportunities based on premium yield, strike probability, and liquidity conditions.
A question kept coming up:
“If someone actually followed the analysis, what would the results look like?”
Instead of projections, backtests, or hindsight charts, I measured the results using actual market outcomes.
Below is the breakdown.
Measurement Window
Launch date: January 1
Data used in the analysis included:
• Strike prices selected by the CCR model based on premium yield targets and assignment probability
• Actual stock prices at cycle completion to determine ITM / OTM outcomes
• Option premium levels at entry to measure income potential per contract
• Liquidity filters including option volume and open interest to ensure tradable contracts
• Distance from the strike price at entry to gauge positioning relative to the underlying stock
• Probability indicators derived from option delta to estimate assignment likelihood
• Underlying stock trading activity and market liquidity
• Standardized ~30-day expiration cycles where option liquidity and premium density are typically strongest
Total opportunities evaluated so far:
1,204 covered call setups
Each opportunity represents a contract where the system identified:
• Strike price selected based on proximity to the underlying stock and optimal premium opportunity
• Premium yield calculated as option premium relative to the stock price to estimate income potential
• Probability indicators derived from option delta and pricing signals to estimate the likelihood of assignment
• Liquidity thresholds including option volume and open interest to ensure contracts were actively tradable
• Distance from the strike price to measure how aggressively or conservatively the call was positioned
• Cycle duration, typically targeting ~30-day expirations where liquidity and premium density tend to be strongest
How Outcomes Were Classified
To keep things simple and operational, outcomes were classified into the two results that matter most for covered call sellers.
In-The-Money (ITM)
Stock price finished above the strike price
Typical result:
• shares called away
• premium captured
• stock appreciation realized up to strike
Out-Of-The-Money (OTM)
Stock price finished below the strike price
Typical result:
• option expires worthless
• premium fully retained
• shares remain available for the next cycle
Results Since Launch
Across 1,204 opportunities analyzed:
Outcome Positions Percentage
OTM. 663 55%
ITM 522 43%
Near-ATM 19 ~2%
Visual Distribution of Outcomes
Outcome Distribution (1,204 Opportunities)
OTM | ████████████████████████████████████████ 55%
ITM | ████████████████████████████████ 43%
ATM | █ 2%
This distribution is actually very healthy for a covered call income strategy.
Many people assume covered call sellers always want options to expire worthless.
In reality, a balanced mix of outcomes is often more productive.
Why The OTM / ITM Split Matters
Some retail strategies intentionally push strikes very far above the stock price.
That often produces:
• 80–90% OTM outcomes
• very small premiums
• slower income generation
The model used here intentionally operates closer to the strike price, where option premiums are richer.
The trade-off is that assignment probability increases.
That’s not a flaw — it’s part of the design.
Strike Placement Behavior
Looking deeper into the dataset:
• ~80% of contracts were within ±2% of the strike price at entry
This is often called the high-premium zone, where option prices are most efficient relative to the stock price.
Operating in this zone naturally produces a mix of outcomes:
• some positions move through the strike (assignment)
• others remain below it (premium capture)
Two Income Engines
This is where covered call strategies become interesting.
Instead of relying on a single outcome, income can be generated through two different paths.
Income Engine #1 — Premium Retention
When options finish OTM (55%):
• the full premium is captured
• shares remain owned
• another call can be sold in the next cycle
This is the traditional covered call income path.
Income Engine #2 — Assignment Income
When options finish ITM (43%):
• premium is still captured
• stock appreciation is realized up to the strike
• capital can be redeployed into the next opportunity
For investors comfortable selling shares at predefined prices, assignment becomes a paid exit rather than a failure.
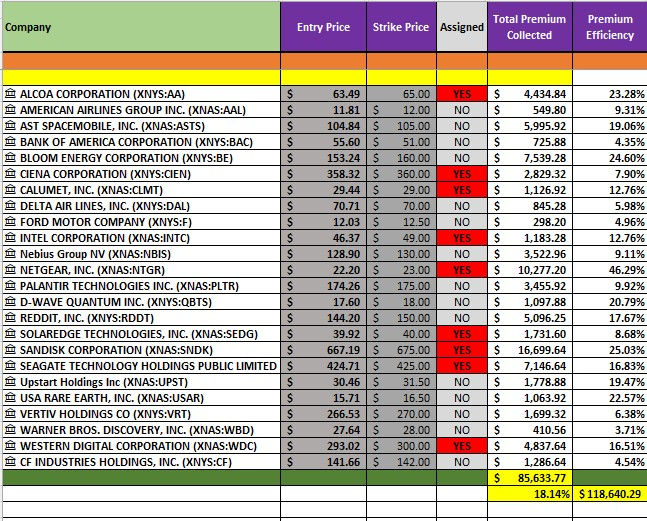
Premium Yield Distribution
Another important metric is the premium yield generated by the opportunities.
Average premium yield across the dataset:
~5.5% per cycle
Premium Yield Distribution
0–2% | ██
2–4% | █████████
4–6% | ███████████████████████████
6–8% | ███████████████
8%+ | ███
Most opportunities clustered in the 4–6% premium zone, which is where many income-focused option sellers aim to operate.
These cycles are roughly 30 days, meaning the model is targeting consistent premium density rather than occasional large wins.
Risk Tier Behavior
The system also categorizes opportunities by assignment probability.
Two common tiers appear in the dataset:
Aggressive Tier
• higher delta
• higher premium
• higher assignment probability
Balanced Tier
• slightly lower premium
• lower assignment probability
• more premium-retention outcomes
This allows investors to choose how much call-away risk they want to accept.
The Bigger Lesson
The most interesting takeaway isn’t the exact percentages.
It’s that probability-based strike placement behaves predictably across large samples.
Across more than 1,200 opportunities, the results produced a natural mix of:
• premium capture
• assignment exits
• repeatable income cycles
Instead of trying to force one specific outcome.
The goal of CCR is simple:
Help retail investors see the probabilities, premium potential, and strike logic before placing the trade, so decisions are made with clearer information.


Comments